We are pleased to announce that PileAXL 2.5.1 is released with the following key improvements and updates:
Version 2.5.1 - September 2024
New Features:
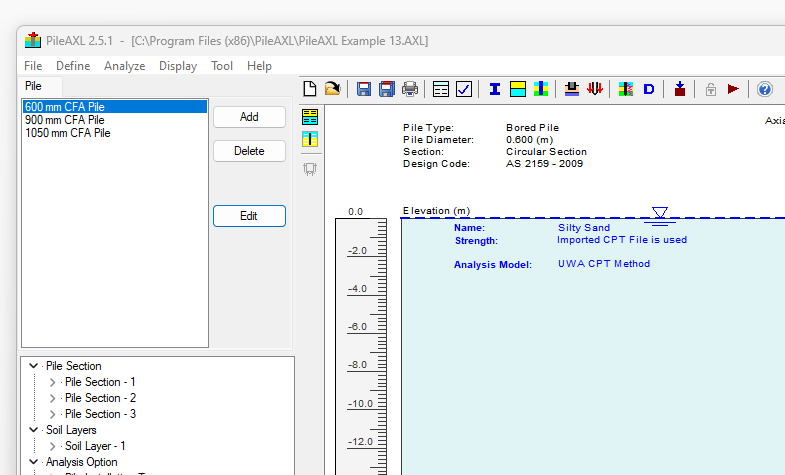
Program Interface:
User interface main window slightly improved with re-arranged toolbars with additional functions
LCPC method input based on Bustamante and Gianeselli (1982) is now included into the dialog of "View /Edit Pile Section" dialog

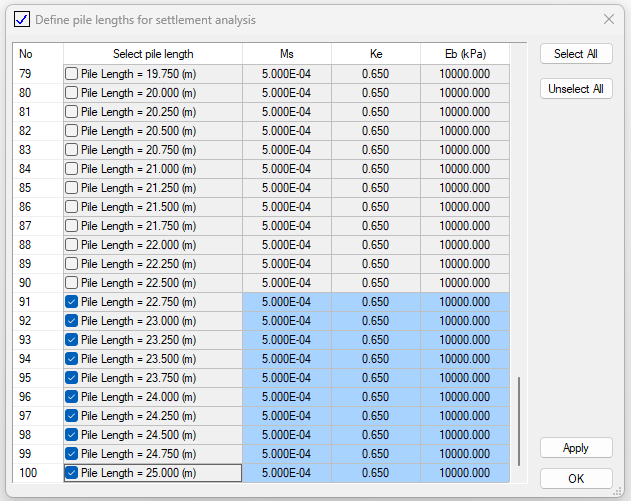
A new dialog is included to define pile head axial load for pile settlement analysis.

Improved support to English Units. This version fully supports both SI and English units.

Added "Print" function to "Pile Input Summary" and "Soil Layer Input Summary" dialogs. Both pile section and soil property inputs can be printed into hardcopy or PDF file.


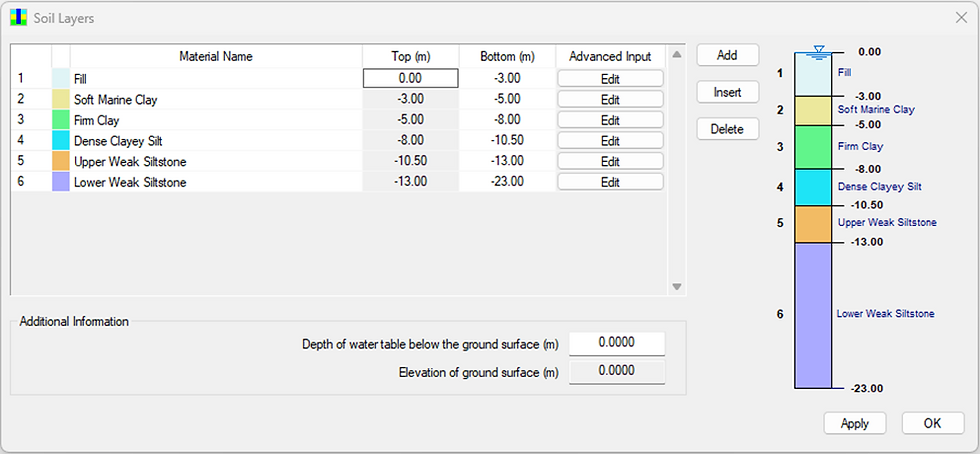
Improved dialog for defining soil layers by displaying the soil layer names and levels on the right side for better clarity and organization.
Improved T-Z curve dialog to include more details about the T-Z curve plots

Improved Q-Z curve dialog to include more details about the Q-Z curve plots

Added Fleming's approach for pile settlement calculation:
PileAXL Version 2.5.1 incorporates Fleming's method (Fleming, 1992), a widely recognized approach for analyzing pile settlement under axial loading conditions. This feature allows users to define distinct sets of parameters for Fleming's method based on varying pile lengths, enabling more accurate and flexible pile settlement analysis.
CPT Manager:
Added CPT Data Table to show all the CPT data and interpretated results.

Added "Save to CSV File" and "Print CPT Data" to the dialog of "Edit CPT Data".

PileAXL Output Program:
The analysis results for pile axial capacity are now displayed across multiple pile sections, with the relevant design code information shown on the same plot for easy reference and compliance verification.

A new dialog is included for selecting the result type for each graphic plot on the main graphic area of the output program.

Improved printing function for the axial capacity analysis results.

Improved single axial design capacity plot
The users can select different analysis result type to plot for all the selected different pile sections by clicking the drop-down menu next to the label of “Analysis Results Plot Selection”. All the pile sections will be listed within the grid table next to the graphical plot area.
The users can select the pile sections which they want to display in the main graphical area. This can be achieved by selecting or deselecting the pile sections and clicking the “Apply” button. Clicking “Select ALL” will select all the pile sections and clicking “Select None” will deselect all the pile sections. Note that at least one pile section should be selected.
Users can adjust the line thickness, line type, and color for each pile section plot by clicking on the pile section name next to the “Select” checkbox. This action will open a separate dialog box, as shown in the figure below.

Improved multiple axial design capacity plot:
The users can select different pile section to plot for all the selected axial capacity results by clicking the drop-down menu next to the label of “Pile Section”. All the axial capacity results will be listed within the grid table next to the graphical plot area.
The users can select the axial capacity results which they want to display in the main graphical area. This can be achieved by selecting or deselecting the various plot items and clicking the “Apply” button. Clicking “Select ALL” will select all the plot items and clicking “Select None” will deselect all the plot items. Note that at least one plot item (axial capacity result) should be selected.
Users can adjust the line thickness, line type, and color for each pile section plot by clicking on the pile section name next to the “Select” checkbox. This action will open a separate dialog box, as shown in the figure below.

Improved Load settlement curves - T-Z and Q-Z Method
The load-settlement curve plot dialog for the T-Z and Q-Z methods has been enhanced with adjustments to the width, improved legend display, and updated line styles for clearer visualization.

Improved axial force distribution curves for varying pile lengths:
The axial force distribution curve plot has been enhanced with adjustments to the width, improved legend display, and updated line styles for clearer visualization.

Added dialog for pile settlement curve plot based on Fleming's Approach (Fleming 1992):
A new dialog is added for pile settlement curve plot based on Fleming's Approach (Fleming 1992).

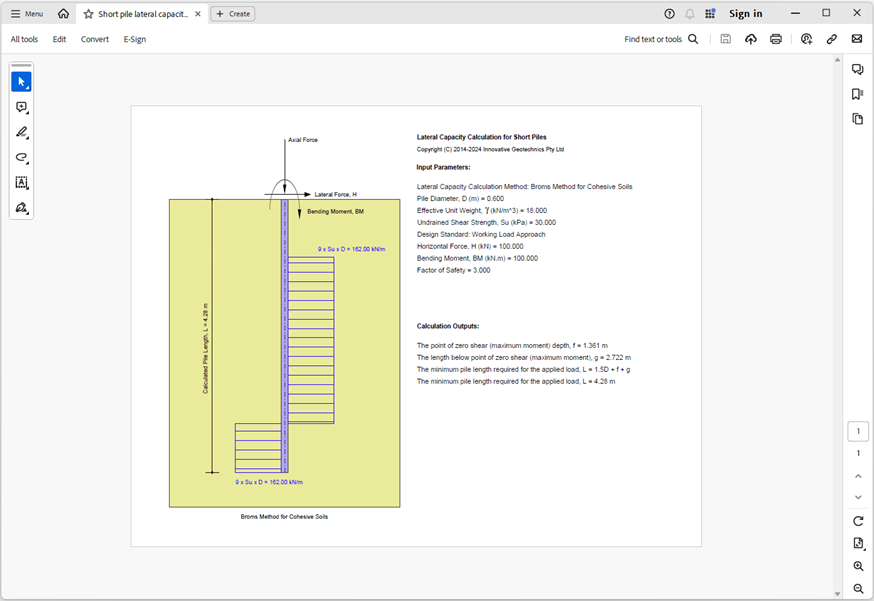
Improved short pile lateral capacity tool:
The tool for short pile lateral capacity tool is improved in the new version. It offers a straightforward and powerful tool for calculating the lateral capacity of short piles subjected to lateral forces and bending moments at the pile head. It uses Brom’s method for analyzing cohesionless and cohesive soils.

A new printing function is added to print the analysis results into hardcopy.
Added rock socket lateral capacity tool:
The tool for rock socket lateral capacity tool is added in the new version. It offers a straightforward and powerful tool to determine the capacity of rock sockets under lateral force and bending moments applied at the pile head, following the methods outlined in the Hong Kong Geoguide 1 (2020).

PileAXL Version 2.5.1 includes four different options as below:
Method 1: Socket Top above Point of Zero Shear (Lateral Bearing Failure). This is based on Figure 52 of the Hong Kong Geoguide 1 (2020).
Method 2: Socket Top below Point of Zero Shear (Lateral Bearing Failure). This is based on Figure 53 of the Hong Kong Geoguide 1 (2020).
Method 3: Specified Dip Angle of Discontinuity (Planar Discontinuity Controlled Failure). This is based on Figure 54 of the Hong Kong Geoguide 1 (2020).
Method 4: Searching for Critical Dip Angle of Discontinuity (Planar Discontinuity Controlled Failure). This is based on Figure 54 of the Hong Kong Geoguide 1 (2020).

A new printing function is added to print the analysis results into hardcopy.

Improved output report generator:
A built-in report generator in the PileAXL output program is improved to generate the calculation report which includes all the input parameters and output results.

Updated PileAXL User Manual
The PileAXL user manual has been updated to reflect all the enhancements in this new version release. You can access the latest version of the user manual here: PileAXL Ver 2.5.1 User Manual.
Please contact us at support@pilegroups.com for more information.


Comments